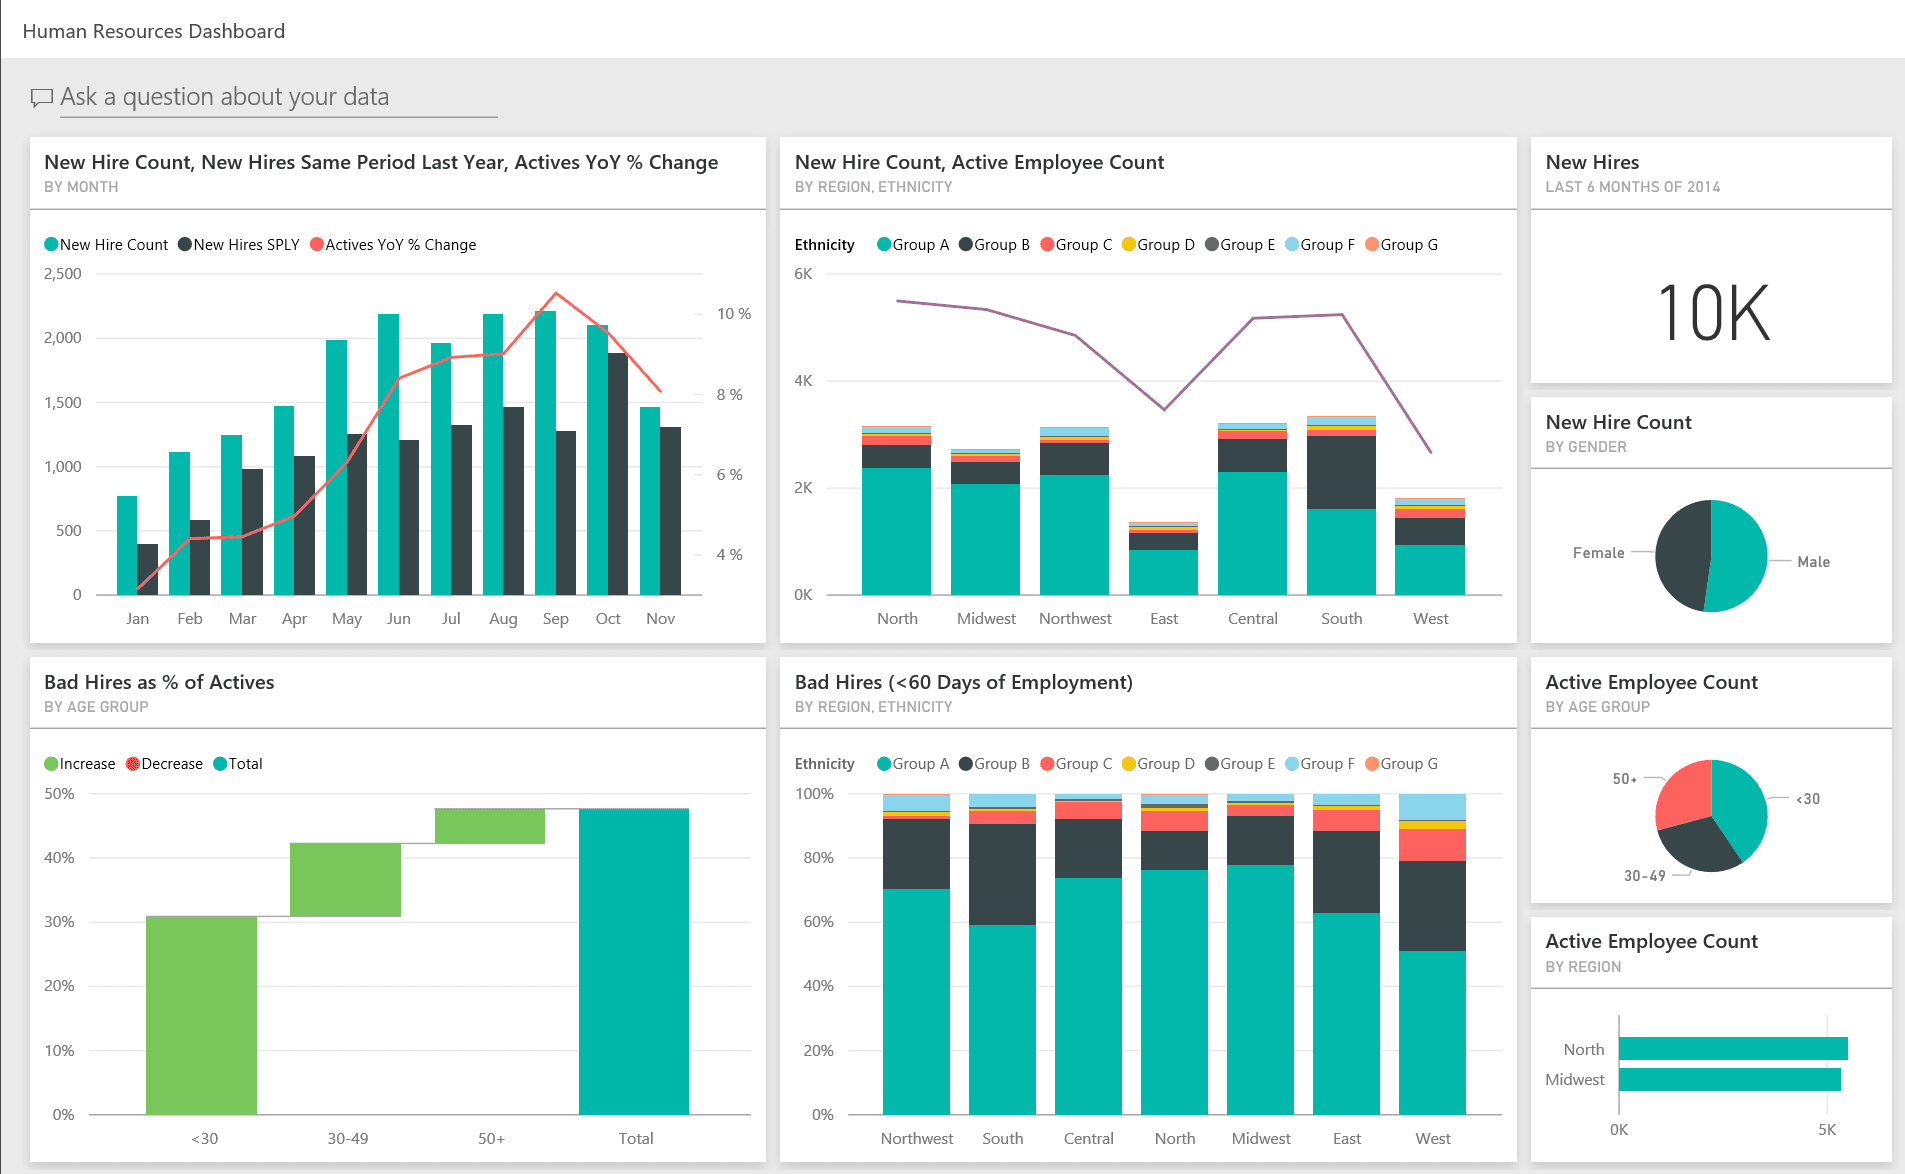
The dashboard generally is like an information hub for the Driver of a vehicle, giving key stats of what is happening with the vehicle in real time, and the controls allows him to make fine adjustments and probe further to understand what’s happening to the vehicle. In the context of Business Intelligence, I would define a Dashboard as: A panel that displays the current status of metrics and key performance indicators (KPIs) for an enterprise, with the ability to pull real-time data from multiple sources
Let’s go back to our Vehicle analogy earlier to better understand how a Dashboard is crucial to Business Intelligence. Let’s assume the car to be a company, now take a look at the images below.


Obviously the second image looks cleaner.
I transferred the information from the car dashboard into an Excel sheet for comparison. The car dashboard provides a clear and concise snapshot of essential information, while less critical details are kept out of view. For instance, the ABS column on the sheet indicates everything is fine, just as the absence of the ABS warning light on the dashboard confirms the same. Similarly, other indicators remain off, signifying no issues. However, the Excel sheet presents an overwhelming amount of irrelevant information, making it harder to focus on what matters. This information overload can hinder decision-making, especially when quick insights are needed while navigating complex scenarios, compared to the clarity offered by a dashboard.
Data serves as a means to an end, with that end being actionable insight. Insight provides a competitive edge, and Business Intelligence tools are designed to achieve this. They enable you to extract data from diverse sources, such as Excel sheets or SQL Server databases, and present it in intuitive, user-friendly dashboards rich with features to help you analyze and act on your data effectively.


