The Challenge: A Systemic, Widespread Spreadsheet Bottleneck
While the participants came from completely different sectors, ranging from procurement and logistics to FMCG retail they all shared a common operational headache: the legacy spreadsheet trap.
Before entering the program, the structural bottlenecks across their organizations were strikingly similar:
- Severe Reporting Lag: Teams spent days manually aggregating weekly performance metrics, leaving leadership to make critical business decisions based on backward-looking data.
- Fragile Workflows: Heavy reliance on complex, manual Excel formulas meant that a single broken link or accidental deletion could halt entire department reporting tracks.
- Isolated Data Silos: Data remained locked in disparate applications, with very few individuals possessing the technical capability to extract, clean, and model it efficiently.
The Strategy: Architecture Over Syntax
Instead of delivering a generic, feature-by-feature software walkthrough, the training framework was built around universal business logic and production-ready data architectures. The curriculum was designed to arm participants with a plug-and-play framework they could deploy inside any company.
1. Advanced Data Modeling & ETL (Power Query)
- Moving participants away from fragile, manual data manipulation.
- Teaching automated data ingestion, advanced transformations, and robust star-schema relational modelling to establish a bulletproof single source of truth.
2. Analytical Depth (DAX)
- Moving beyond basic summaries and superficial metrics.
- Empowering the cohort to write advanced Data Analysis Expressions (DAX) for dynamic time-intelligence, complex filtering, and granular corporate KPIs.
3. High-Context Data Visualization
- Shifting the mindset from cluttered, colourful charts to minimalist, insights-driven dashboards.
- Designing strictly for user intent and cognitive ergonomics—ensuring stakeholders can extract actionable insights within five seconds of viewing a report.
The Execution: The Multi-Company Cohort Framework
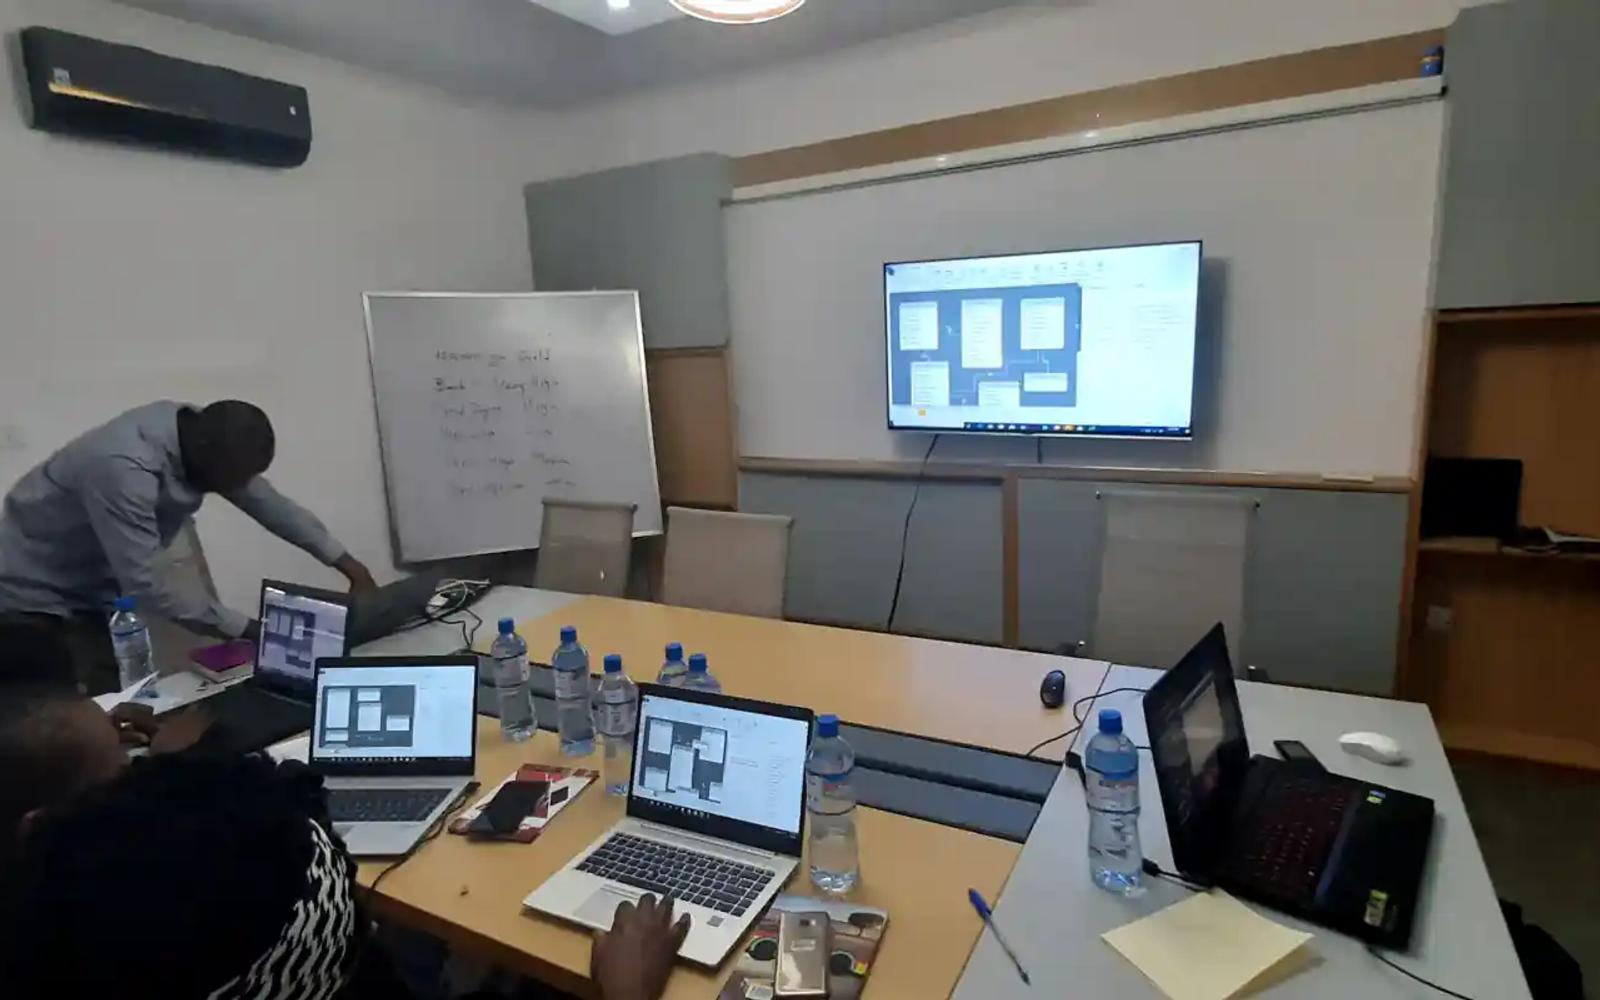
The program leveraged a fast-paced, practical sandbox environment where diversity of data became a feature, not a bug:
- Cross-Pollination of Use Cases: Because participants came from different corporate backgrounds, peer-to-peer learning was highly collaborative. A logistics professional's inventory modelling challenge offered unique architectural insights to a retail inventory analyst.
- The Blueprint Capstone: To graduate, each participant was required to design, build, and defend a functional enterprise-grade dashboard tailored to their specific organization's live operational needs.
The Impact & Value Delivered
The training acted as a catalyst for immediate internal digital transformation, turning the participants into internal data champions within their respective firms.
Immediate ROI: Rather than returning with theoretical knowledge, every participant walked back into their office with a fully built, production-ready dashboard optimized for their specific business.
- Up to 80% Time Reductions: Across the represented companies, repetitive reporting tasks that historically drained 10–15 hours a week were fully automated into self-refreshing pipelines.
- Instant Executive Buy-In: Participants reported that their newly deployed dashboards fundamentally shifted how their leadership teams interacted with data, moving from reactive arguments over "whose numbers are right" to real-time strategic execution.
- Career Acceleration: By positioning themselves as data automation anchors, multiple participants successfully scaled their internal roles, driving a culture of data literacy across their wider departments.
Project Gallery
Click any image to view full screen.


Ready to start a similar project?
Let's discuss how our expert Data Analytics solutions can drive measurable growth for your organisation.
Start a Conversation